In my previous post, we look at measuring plate discipline by using the Swing% statistic, which measures how often a player swings. Let’s drill down a little further by dividing swings into two categories: swinging at strikes and swinging at balls.
The statistic O-Swing% is designed for that. It measures the percentage of pitches outside the strike zone that the batter swings at.
O-Swing% = Swings on Pitches Outside Strike Zone / Pitches Outside Strike Zone
Another term for O-Swing% is the batter’s “chase rate.”
Swing numbers “stabilize” earlier than many other hitting stats. At about 60 plate appearances, the batter has enough of a record that we can judge the early part of his season.
To say a statistic “stabilizes” doesn’t mean it is predictive. Batters change over the course of a season. For example, research shows that in general, plate discipline declines as the year goes on, with the culprit believed to be fatigue.
It’s also worth pointing out that not all chasing is created equal. Swinging at a pitch just off the plate is different from swinging at a pitch a foot out of the zone. The O-Swing% statistic doesn’t differentiate between those two.
Before we look at the Reds, let’s analyze the league as a whole as it relates to O-Swing%. Unlike the overall swing rate (Swing%, blue line) which has stayed constant over the past 18 seasons, O-Swing% (green line) has risen.

In 2002, players swung at 18% of pitches out of the strike zone. Today, players swing at 30%. That’s a healthy increase. It’s important to point out that league O-Swing% has leveled off and remained relatively steady for the past ten seasons.
How have the Reds compared with the MLB average in O-Swing% since 2002?

Other than a spike in 2003 (Jose Guillen and Aaron Boone were the culprits), the Reds have tracked close to overall league trends in swinging at pitches outside the strike zone. Data from April 2019 conforms as well.
Since we’re trying to evaluate players based on plate discipline, what does O-Swing% tell us about that?
In this case, the lesson is clear:
Swing at the strikes and lay off the pitches that aren’t strikes. This basic rule of thumb is born out by actual results. Data convincingly shows that swinging at the right pitches is positively correlated with batting average, on-base percentage and hitting for power.
Let’s take every MLB plate appearance since 2008 (that’s over a million PA) and look at the results of those swings based on whether the pitch was (a) in the middle of the plate, (b) a strike, but not in the middle of the strike zone and (c) outside the strike zone. It’s clear that the batter’s does better when he’s selective in his swing decision:

Batting average (AVG) is .335 when the pitch is Right Down Broadway. AVG falls off to .171, or about half, when pitches would be called balls. The success rate for swinging at strikes, but off the middle of the plate, is somewhere in-between, as you would expect. Data from the million plate appearances confirms a similar pattern for hitting with power (ISO) and weighted, overall offensive performance (wOBA).
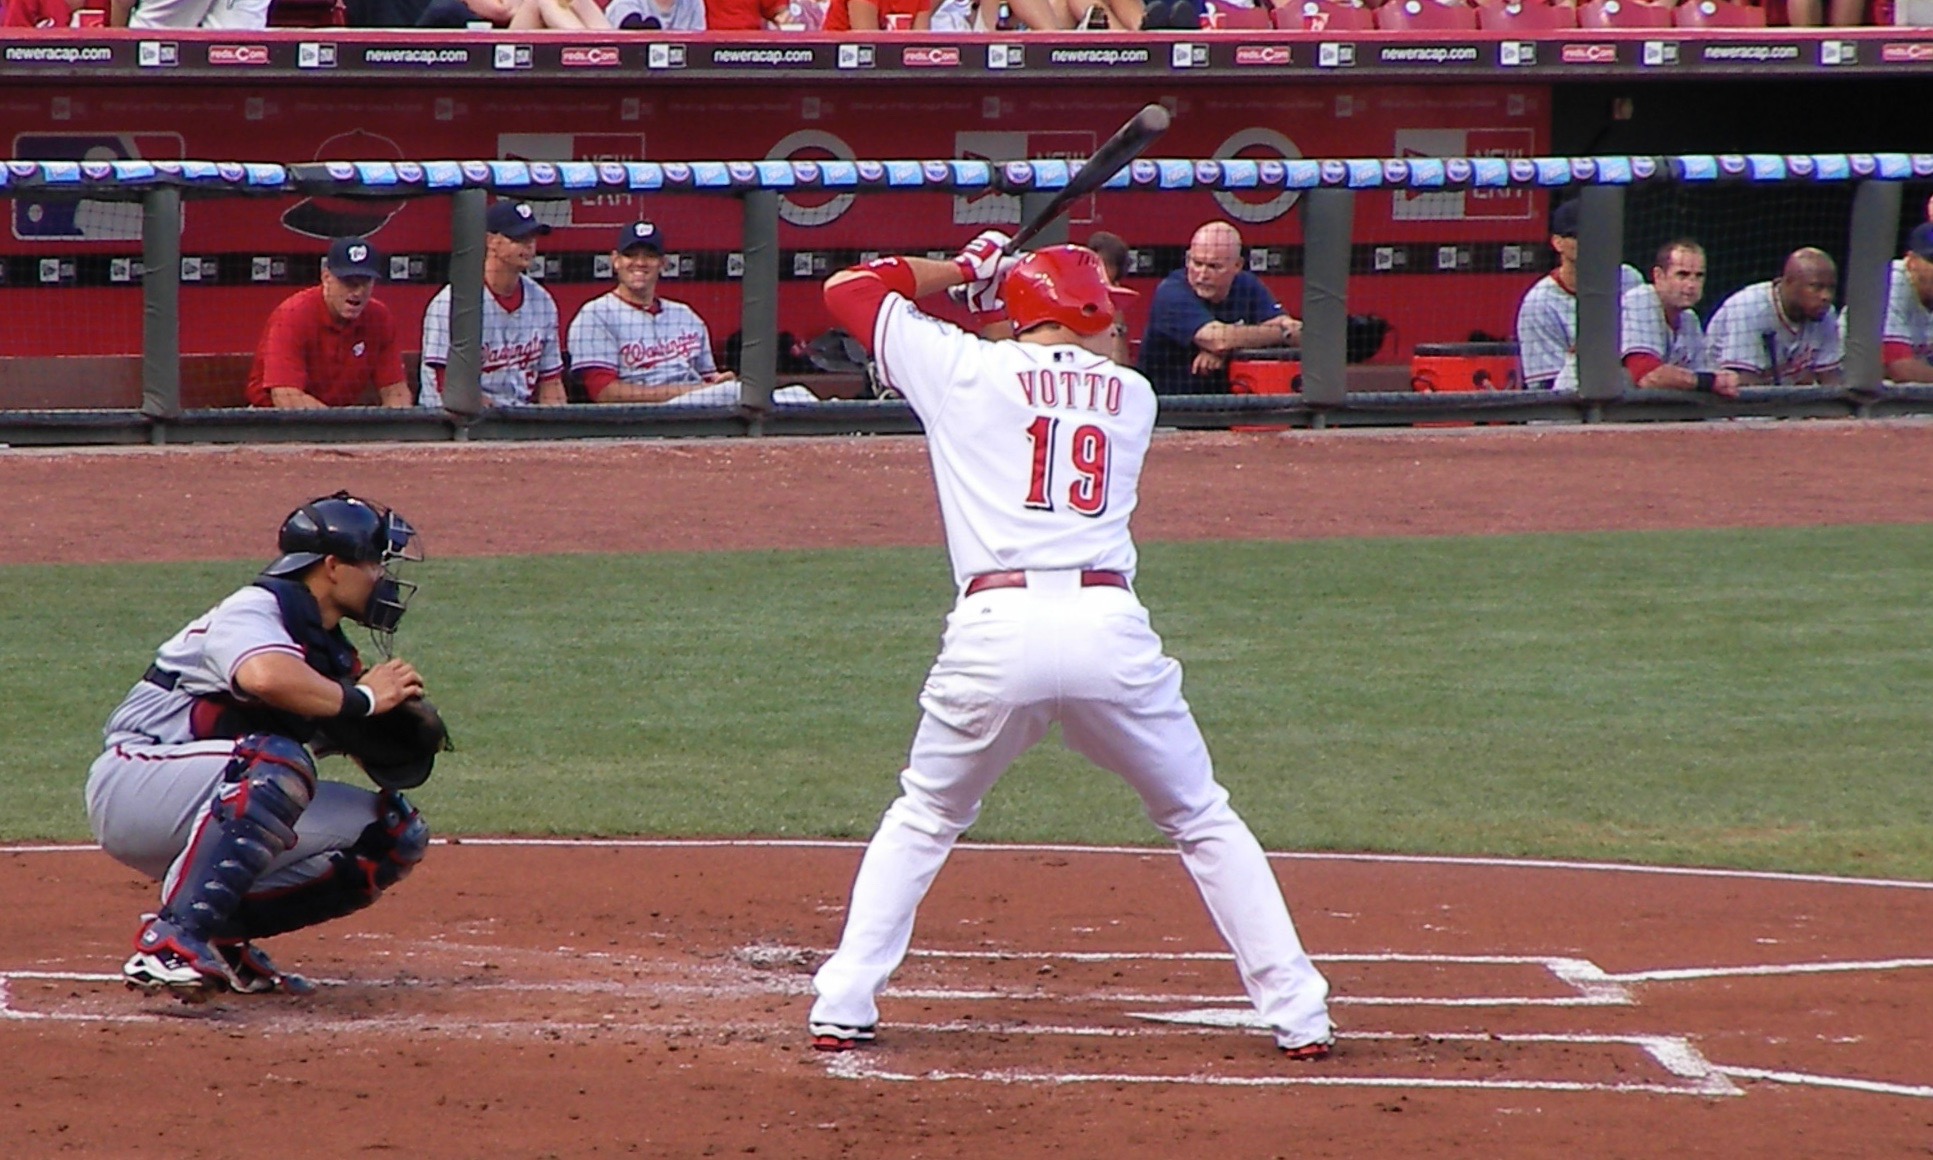
Even players as talented as Joey Votto exhibit this pattern. This heat map shows Votto’s career batting average for every zone of the plate.

Note his career batting average is .375-.421 on pitches in his wheelhouse, and falls to numbers like .122, or .247 outside the zone
Votto’s numbers for isolated power (ISO) tell a similar story.

It turns out that Joey Votto knows what he’s doing when he lays off pitches and he’s made himself a pretty good career that way.
Let’s take a look at O-Swing% for individual Reds players (numbers through game of May 9).

League average for 2019 is 30.0%. Looking at career data, you can group the Reds position players into three categories.
- Disciplined: Eugenio Suarez, Joey Votto, Jesse Winker, Nick Senzel (SSS)
- Average: Tucker Barnhart, Derek Dietrich, Yasiel Puig
- Undisciplined: Kyle Farmer, Scooter Gennett, Jose Iglesias, Matt Kemp, Jose Peraza, Scott Schebler
Most of the Reds players in 2019 have been right around their career averages in terms of swinging at pitches outside the strike zones, with a few exceptions.
Matt Kemp’s rate of 39.2 was well over his career rate and 2018, but inline with his 2016 and 2017 number. That’s a late-in-career sign of swinging more. Same with Jose Iglesias, who has always been relatively undisciplined, but his number has inched up the past couple seasons.
Yasiel Puig has seen a spike his O-Swing% in 2019. In his case, we may be seeing an adjustment period moving to a new team and manager.


