
The Reds’ pitching staff has made a dramatic turnaround in 2019. The number one reason is they’re missing more bats, but they’re doing many things well. Limiting hard contact is another area where they’re excelling.
A few weeks ago, I looked at exit velocity as it relates to pitchers. Does it matter? Other factors — strikeouts being the biggest one — are more important to success. But of course, pitchers want to mitigate hard contact as much as possible, and the best ones can miss bats and limit hard contact with a combination of command and nasty stuff.
How can we extend these conclusions to the Reds’ current pitching staff and its success through the first two months of the 2019 season?
The Big Picture
No team has seen such a dramatic improvement from the pitching staff than the Reds. They rank second in FIP (3.73) and xFIP (3.85), third in ERA (3.58), and fourth in SIERA (3.95). Last year, they came in at 24th in ERA, 27th in FIP, 21st in xFIP, and 22nd in SIERA. Obviously, several components have gone into that change. But is a lower exit velocity one of them?
As a team, the Reds are tied for eighth in average exit velocity (87.7 mph), lining up with the overall improvements the staff has made. Last year, the Reds ranked 21st. However, the previous three years, they finsihed 9th, 10th, and 10th. There’s your first clue that exit velocity isn’t everything. More on that later.
They also rank well in several expected statistics in 2019, which exit velocity plays a huge role in.
- xBA (.230): 3rd
- xSLG (.364): 2nd
- xwOBA (.294): 4th
Those numbers align closely with the team’s actual batting average (.233), slugging percentage (.379), and weighted on-base average (.297).
Now, let’s compare these numbers to the 2016 pitching staff, which might have been the worst in the history of baseball. Curiously, that team actually fared better in exit velocity (87.5 mph) than this year’s group, the caveat being that the 2019 league average (88.2 mph) has gone up by 0.5 mph from 2016 (87.7 mph). The ‘16 staff had — try not to throw up — was worth a collective 0.9 fWAR, posting a 4.91 ERA, 5.24 FIP, and 4.79 xFIP.
Does that mean exit velocity is meaningless? Again, no. But remember: keeping runners off base is the top priority, and missing bats plays an enormous role in it. And the Reds are doing that better than almost every other team. Only the Astros (27.5%) have a better team strikeout rate than the Reds (26.1%). The 2016 Reds came in at 19.6%, which meant a whole lot of balls put into play. More balls in play, of course, means the pitcher is relying a lot on luck and defense. Compound that with a league-worst walk rate (10.0%) and there were some clear problems despite the respectable exit velocity.
When the ball does get put into play, however, there’s an ideal place for it to go: the ground. This is where a low exit velocity particularly plays in the 2019 Reds’ favor and against the 2016 Reds.
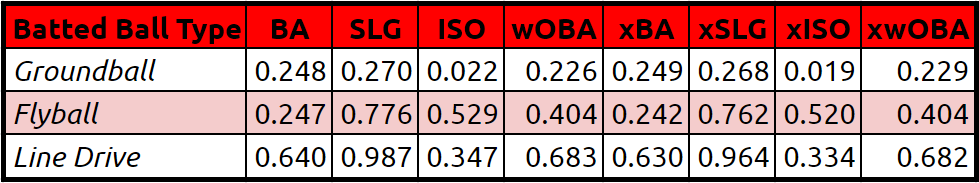
The Reds are sixth in MLB ground ball rate at 45.4%; the 2016 team was 26th at 41.6%. While lazy fly balls are the surest way to get an out, ground balls have the worst outcome for hitters in a vacuum, especially in the new era of shifts. Fewer fly balls means fewer home runs. Fewer line drives means fewer hits of all fashion. Here are the league average numbers on each batted ball type since 2015:
The propensity for ground balls paired with a below-average exit velocity means the Reds are one of the best teams at preventing home runs. Only the Rays (0.87 HR/9) have allowed fewer long balls than the Reds (1.06) this season. You’ll regretfully remember that the 2016 Reds pitching staff set the all-time record for home runs in a season (although the Orioles, Mariners, Angels, and Phillies are all on pace to break that record in 2019).
Why are the Reds getting so many ground balls this year? Part of the explanation ties to the team wide philosophy of throwing more breaking balls, a trend seen around baseball. The Reds are throwing curveballs and sliders 33.0% of the time, up from 28.0% last season. Meanwhile, the team’s fastball usage has dropped from 60.2% to 50.3%.
While sinkers get their fair share of grounders, breaking balls get more than fastballs as a whole. Since 2015, breaking balls have a 46.9% ground ball rate, while fastballs sit at 44.1%. Sliders and curves also have the bonus of generating more whiffs and keeping the ball out of play to begin with.
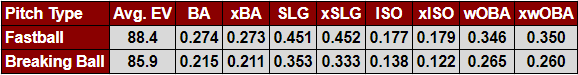
The new pitch mix not only helps the Reds get more ground balls, but it also limits hard contact in general. Here’s a breakdown of both pitch categories and their results since 2015:
Another huge reason the Reds rank highly in exit velocity: staying away from the middle of the strike zone. No team has thrown a lower percentage of pitches in the heart of the plate than the Reds at 21.8%. The next closest team is the Diamondbacks at 23.2%. Take a look at the heatmaps from every pitch in 2018 (left) and ‘19 so far (right):
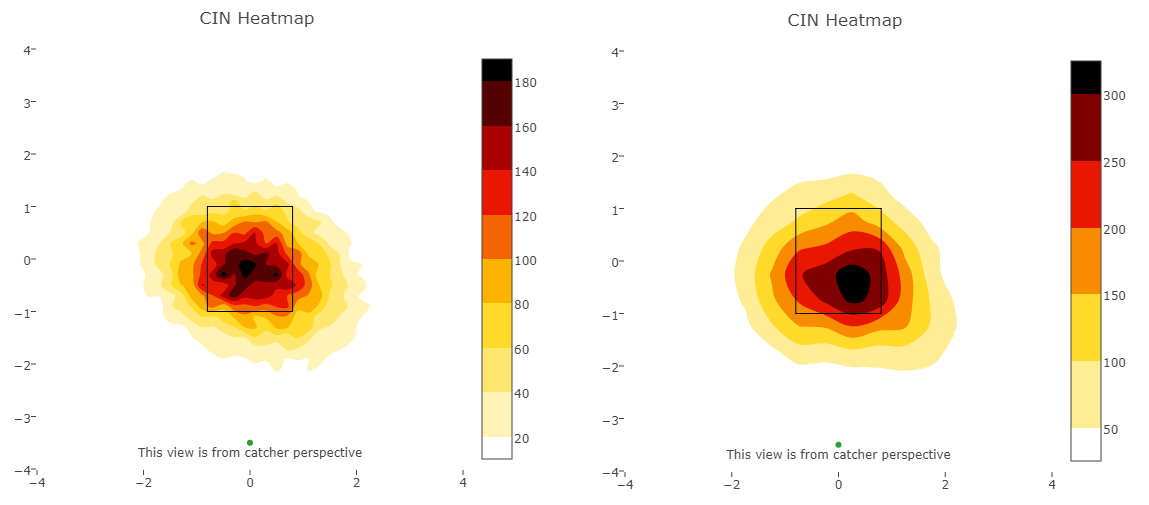
The difference is clear: we can see more dark colors on the corners of the plate instead of in the middle. Unsurprisingly, the Reds were tied for third in Heart% last season.
Staying out of the heart of the plate does lead to more walks in some cases, and the Reds fall under that umbrella. They fall in the middle of the pack in walk rate (8.7%). Although they’re avoiding the heart of the plate, they’re not catching the corners as much, ranking 29th in pitches on the edge of the strike zone (40.9%). Instead, they’re throwing more in the “chase” zones (23.1%), partially a result of throwing more breaking balls.
To reiterate the takeaway from all this: Strikeouts have been the most important component of the pitching staff’s turnaround. But throwing away from hitters’ strengths and using more breaking balls has kept the ball from getting punished when it does go into play.
Individual Standouts
Here are the Reds leaders in exit velocity so far this season:
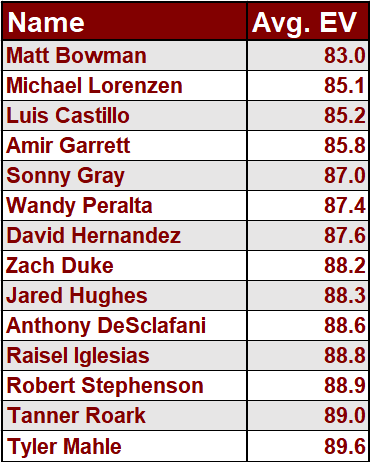
The Reds have seven pitchers who have held opposing hitters to a below average (88.2 mph) exit velocity; some have had success and others have not. The one who sticks out is obviously Luis Castillo. That’s not surprising considering he’s been one of the best pitchers in the league. Not only is he missing bats at an elite rate (29.1 K%), but he’s also limiting hard contact like he did in 2017. Among starting pitchers with at least 100 batted balls against them, only Rich Hill, Martin Perez, and Kenta Maeda have held batters to a lower average exit velocity than Castillo (85.2 mph).
It’s easy to see why hitters have a hard time squaring Castillo up. He throws a fastball averaging 96 mph. His changeup has the highest swinging-strike rate (28.6%) of any off-speed or breaking pitch among starting pitchers, tied with Cole Hamels’ changeup and Kyle Gibson’s slider. Castillo is also staying away from hitters’ sweet spots, dropping his Heart% from 28.1% to 19.4%. Paired with an effective sinker, Castillo is piling up ground balls (56.8%) more than every qualified pitcher except Dakota Hudson and Marcus Stroman.
Right behind Castillo is Sonny Gray (55.9%). Gray, of course, throws an exceptional slider and curveball and is using them even more in a Reds uniform. Amir Garrett falls into that category as well; he’s throwing more sliders than ever and getting more grounders (53.2 GB%) and weak contact. Michael Lorenzen has dropped his fastball usage dramatically, from 52.1% last year to 35.7%.
On the opposite end of the spectrum, Tyler Mahle throws fastballs 64.2% of the time. That’s 18th among 108 starting pitchers with 750 total pitches thrown this season. Fastballs, you’ll remember, get hit harder than any other pitch. Mahle’s fastball has been hit for an average exit velocity of 90.6 mph. He also throws more pitches in the heart of the plate (26.7%) than any Reds pitcher.
Raisel Iglesias is second; unsurprisingly, his exit velocity is up by 3 mph. Iglesias’ ground ball rate is only 23.7%, sixth-lowest among all pitchers with 20 innings this season, which makes the hard contact hurt all the more. Meanwhile, Jared Hughes has pitched well overall (3.30 ERA, 3.81 xFIP) despite a slightly elevated average exit velocity, partly because he initiates so many ground balls (60.5%).
Largely, though, Reds pitchers have avoided hard contact — and it’s a large reason they’re finding success.

