We have many tools to evaluate pitchers, but one thing matters to them all: context. A pitcher’s ERA can be deceiving; a little fairy dust of fortune and good defense can pretty up a pig, but the opposite will slaughter the swine, at least our faith in him.
That’s why we have ERA predictors, like SIERA and xFIP, that try to strip out factors beyond the pitcher’s control. A pitcher doesn’t control whether Jose Iglesias is painting a masterpiece with his glove or Rich Aurilia is throwing paint against a wall at shortstop. Rockets soar into gloves, but dribblers find the narrow path into the outfield grass. A pitcher can only do so much.
But SIERA and xFIP aren’t perfect either. We need to put them in context to more accurately evaluate a pitcher’s performance. For example in 2019, the average xFIP is up significantly for both starters and relievers over 2018:

Average xFIP 2018 and 2019
That’s an enormous difference that should affect how we view a pitcher’s season. For example, Tyler Mahle’s xFIP last season was 4.45, about 0.3 worse than league average. This season, his 3.79 xFIP is 0.71 points better than league average, an improvement of over a full run compared to average over 2018.
We shouldn’t simply compare a pitcher’s ERA, xFIP, or SIERA over multiple seasons and conclude that it tells an accurate story. The run scoring environment changes, meaning that an xFIP of 4.25 might be below average one season and above average the next.
That’s why we now have -stats, like -FIP, -xFIP, and -ERA, to provide vital context as we evaluate pitchers. These stats are put on a scale where 100 is average and every point above or below 100 is a percentage point better or worse than average. The lower, the better. So, an -xFIP score of 105 means the pitcher has an xFIP that is 5% worse than league average.
The Reds starting staff is worlds better than they were last season, and -stats may most accurately display their rise from the depths. First, as a team, Reds starters had the second worst -ERA in 2018, though they were middle of the pack in -xFIP. This season, they have the NL’s third best -ERA (89) and second best -xFIP (90).
The difference is just as stark when looking at individuals. Let’s examine xFIP in particular, as it and SIERA are the best of the ERA predictors, and -ERA. We’ll start with the starters in 2018 that threw at least 100 innings.

2018 Rotation -stats
Some ugly numbers there, especially on the -ERA side where every single pitcher was below average. Only Castillo and Desclafani posted above average -xFIP numbers. The starters pitched better than their ERAs would suggest, but being bad instead of awful didn’t win them any awards…or many games.
With the pain of watching this staff in mind, the Reds orchestrated the “get the pitching” initiative. What they got in the end was a much improved staff, especially as you look at how they’ve performed compared to league average.

2019 Rotation -stats
Everyone but the recently traded Roark have fared well in -xFIP. The starters’ -ERAs have been excellent, minus Mahle’s struggles. Mahle’s xFIP suggests he has pitched better than his ERA, but this is the second straight year that he’s had an elevated homerun rate, meaning the xFIP might be too generous to him.
The additions of Trevor Bauer and Alex Wood should make this rotation even better to finish the season. Bauer numbers with the Indians were above average: -ERA of 79 and -xFIP of 90. Wood’s highest -xFIP in the last three years was 92.
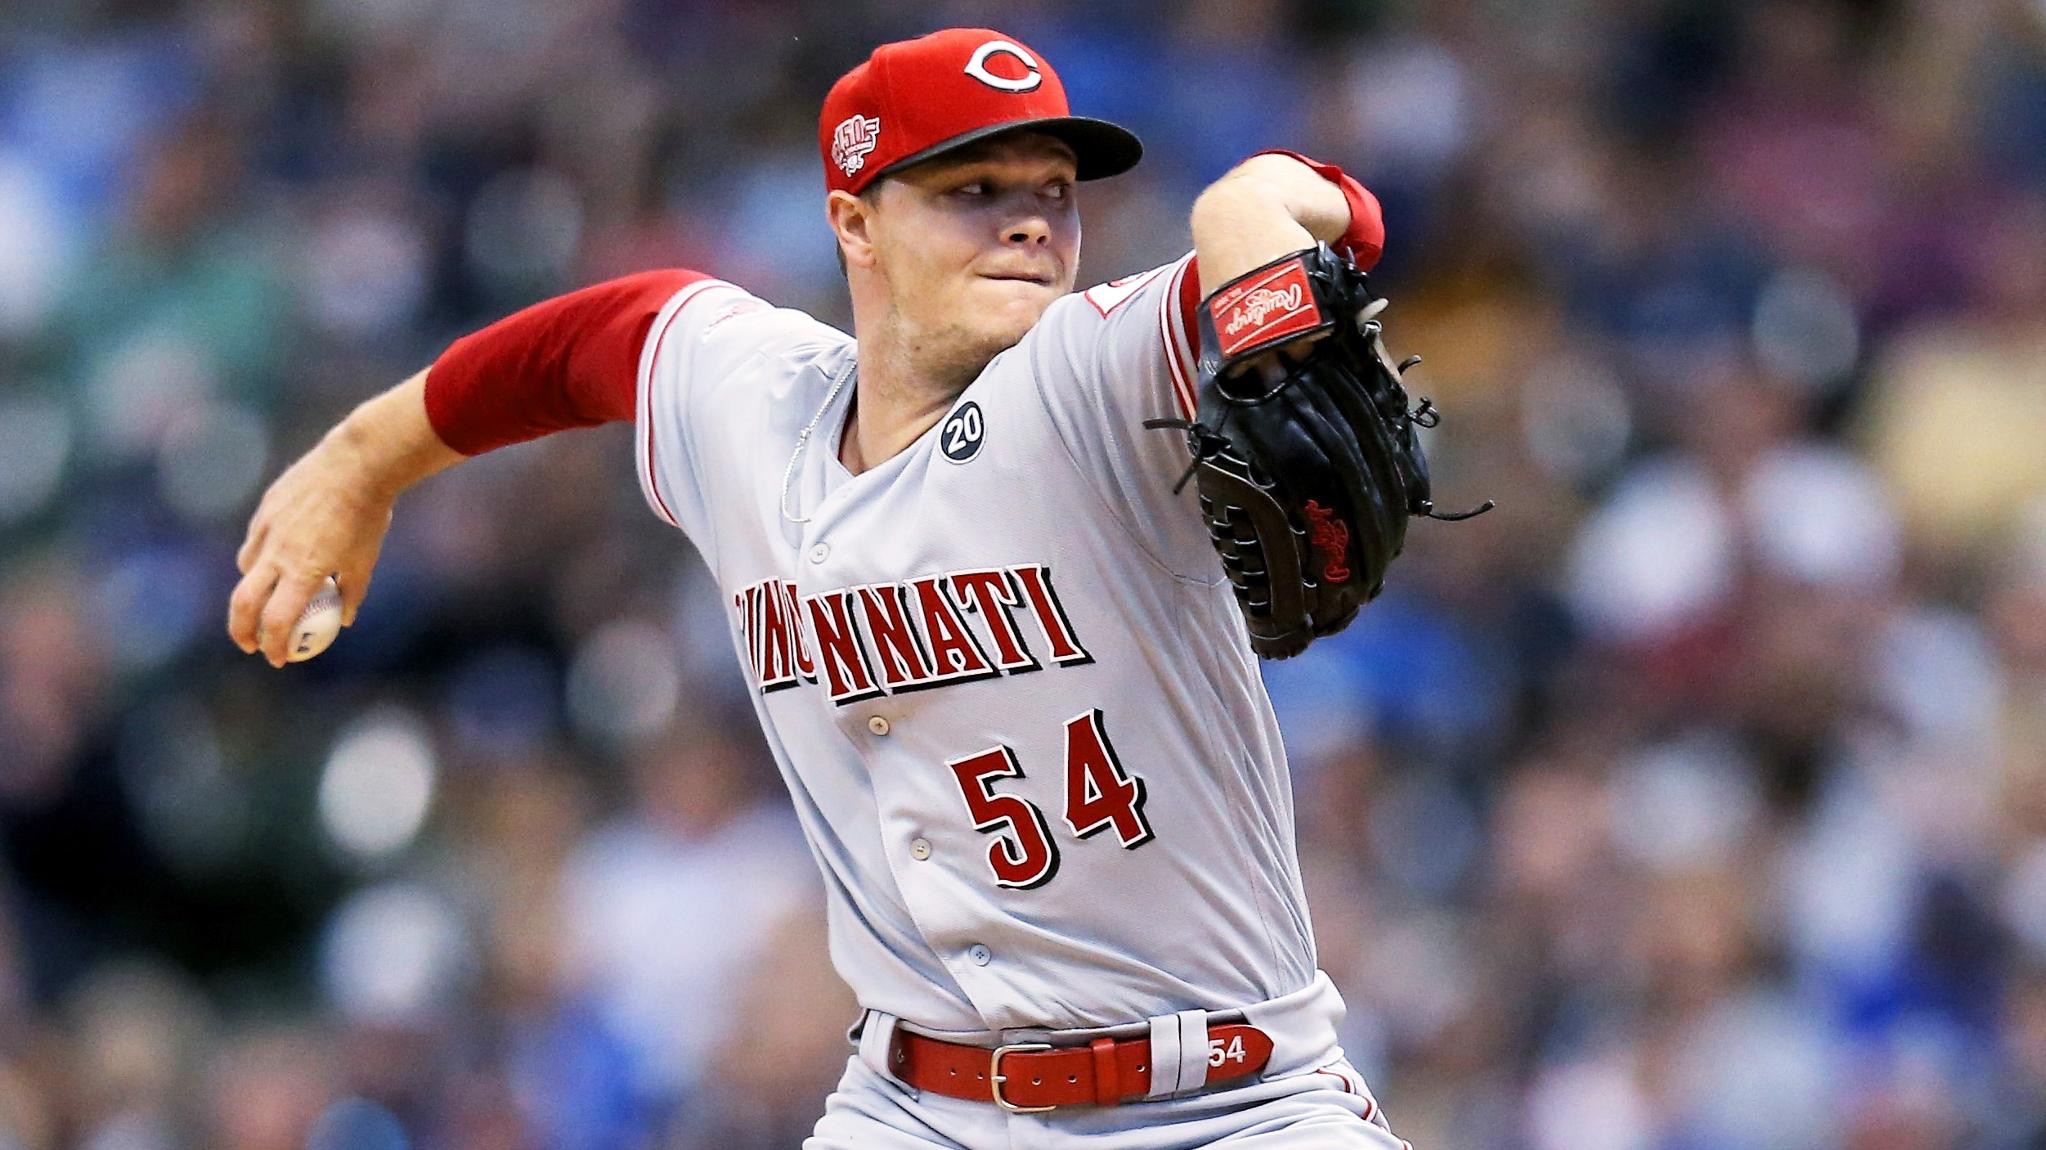
The newcomers have made a significant difference with Sonny Gray arguably pitching like an ace. He’s been every bit as good as Castillo, recapturing the Oakland magic that dazzled fans and bewildered hitters. His reincarnation and Castillo’s growth give the Reds a 1-2 to rival anyone in the division, if not the entire NL.
Pitchers are difficult to evaluate because good results aren’t always indicative of how well someone has pitched and the run scoring environment changes, seemingly from year to year. -Stats give us a tool to identify just how much better or worse than average a pitcher has been. As we look at the Reds pitchers, they have significantly outperformed both their 2018 numbers and the league average.
While teams are always looking to improve their pitching, The Reds have a solid foundation and may be able to prioritize other roster needs.
[Featured image: https://twitter.com/Reds/status/1149736445290196994]


Wow. Better than I thought. Thanks, Nick.