
MLB teams have more information and data than ever before, and each one is trying to leverage it to gain an edge. Defensive shifts are one of the most visible ways in which analytics impacted the game in recent years. Since 2015, there has been a dramatic increase in the percentage shifts per pitch thrown, peaking at 33.6% of plate appearances in 2022.
The result was a decrease in offensive production. More specifically, batting averages cratered as fewer grounders and line drives went for hits and batters struck out more often as they tried to slug the ball over the shift. The 2022 season saw the lowest league batting average (.243) since 1968. The league wOBA (.310) fell to its lowest point since 2014 and was fourth-lowest output in the past 50 years. Left-handed hitters bore the brunt of the decline, largely because defenses could utilize more extreme shifts against them, positioning an infielder in short right field.
But in 2023, the shift is no more. While teams can still position defenders strategically, they must have four defenders in the infield dirt and two infielders on each side of second base when a pitch is thrown.
The shift wasn’t the primary reason for a decline in batting average, of course. After all, two-thirds of plate appearances in 2022 occurred without a defensive shift. The biggest factor is that pitchers are simply better than ever — their pitches have more velocity, spin, and movement. Teams are also more comfortable with hitters trading off some strikeouts for more power because extra-base hits are more valuable than singles. The league keeps messing with the physical makeup of the baseball, as well. However, the shift certainly played at least a small part in the game trending toward the “three true outcomes” over the years.
So, what are we seeing in the early of the 2023 season? And which Reds hitters could be most impacted by the rule change?
The early returns on the shift ban
So far, the league has gotten its wish: more batted balls are falling in for hits. It’s far from a dramatic increase, however. Through the games on April 3, the league batting average was just .249, six points higher than in 2022 (.243). A .249 average would still be the fifth-lowest league-wide output in the last half century. Batting average on balls in play (.298) is up by eight points from 2022 (.290).
We’re still dealing with minuscule sample sizes, so take all of this with a grain of salt.
Let’s narrow this down to the batted balls that were most affected by the shift: pulled grounders and short line drives (in this case, we’ll define short line drives as under 200 feet). Here’s the data compared to last year:

We aren’t seeing a huge uptick in ground-ball production, which isn’t surprising. Teams are still positioning second basemen and shortstops toward the middle of the infield, allowing them to take away would-be hits on pulled grounders. But we are seeing an uptick in production on line drives; without infielders standing in the outfield, short line drives are falling for hits more often.
We can also break this out by platoon splits to see that lefties are indeed the biggest beneficiaries of the shift ban so far.

BABIP on ground balls is up by over 20 points for lefties, while BABIP on short line drives is up by over 150 points. To reiterate that we’re talking about an extremely small sample size, though, note that only 42 batted balls fit the parameters so far (lefty hitter, pulled line drive, under 200 feet). These numbers will change, and the .714 BABIP will probably come down.
However, there’s another notable data point that may explain why the difference is so large for lefties thus far; they’re pulling the ball way more often. Maybe it’s a fluke, but it stands to reason that lefties are attempting to pull the ball more often — resulting in harder contact — without the shift in place. So far this season, lefties are pulling the ball 43.4% of the time, per FanGraphs. That’s up more than three percentage points from last year (40.1%). We haven’t seen pull rates that high for lefties since 2004 (batted-ball data only goes back to 2002).
Again, it’s very early in the season. More data is needed to make any definitive conclusions. But this does line up with the research done by Jayson Stark of The Athletic last September. Using data from Double-A, he took a look at how the shift ban played out when it was put into place for the 2022 season. He found that the rule helped just one additional ground ball out of 20 by lefty hitters get through the infield for a hit. Line drives were a different story, however. With infielders no longer allowed to sit in short right field and snag liners over the infield, the rate of hits nearly doubled on such batted balls.
How will Reds hitters be affected?
Now, onto the Reds. Since left-handed hitters were most affected by the shift and have the most to gain without it, we’ll focus only on them. Here are the Reds lefties on the current roster who faced a shift in at least 25% of their MLB plate appearances last season:
- Will Benson (91.8%)
- Joey Votto (86.2%)
- Jake Fraley (73.8%)
- Jason Vosler (55.5%)
- T.J. Friedl (32.2%)
It’s too far early to tell how the shift ban has affected their production in 2023. So, we’ll look back at last year’s data to see what their numbers might have looked like without the shift over a longer span of time. A necessary caveat: there are many different ways we could try to estimate this, and none will be perfect. But with the copious amount of data available, we can try to get some sense of how the shift ban could affect Cincinnati’s hitters.
First, let’s use expected batting average (xBA) to see what each player’s outcomes “should’ve” been based on exit velocities and launch angles. How many additional hits would the Reds batters above would’ve had in 2022 if their xBA matched their actual average against the shift? Again, we’re looking only at ground balls and short line drives (less than 200 feet) that were pulled.

No hitters saw a massive bump in expected hits using this method, but all stood to gain at least one hit without the shift. Although sample sizes varied, Fraley, Vosler, and Benson were the biggest gainers in batting average, while Votto and Friedl saw smaller increases.
To take it another step further, we can use a method laid out by MLB.com’s Mike Petriello in this analysis of Corey Seager and how the shift ban could benefit him. To isolate the batted balls most affected by the shift, Petriello removed those with these criteria:
- No contact (strikeouts, walks, hit by pitches)
- No defense (home runs)
- No shift
- Big distance (balls hit more than 220 feet)
From there, he took the hit probability of each remaining batted ball. If a Seager had a 60.5% hit probability but the ball went right into the shift for an out, Petriello assigned .605 of a hit. To bring it back to the Reds, this line drive by Fraley had a .906 xBA, so he’d get +0.906 “hits” in his favor instead of the zero he actually wound up with.
But there’s another side to this coin: Petriello also took away hits that are less likely to be hits without the shift. Of course, we’re talking about weak ground balls to the opposite field like the one below by Votto, which aren’t likely to be hits moving forward. This particular hit had a .109 xBA, which means we’d take away .891 of hit.
A quick note: We can’t recreate Petriello’s method exactly because the hit probability he used — which accounts for spray angle in addition to launch angle and exit velocity — isn’t publicly available. So, we’ll settle for using what we have in xBA. Without further ado, here are the results:

With this method, only Votto and Vosler gained hits. Taking away the weak, opposite-field hits resulted in a net loss for the other hitters. Friedl was probably punished unfairly for bunt singles using this approach, as the xBA on any bunt is typically low. Again, though, this is far from a perfect, statistically sound analysis. It’s designed to give an idea of just how much or how little the shift ban will affect hitters.
If you’re surprised, confused, or disappointed by the results, here are a few points to remember:
- Ground balls don’t result in hits that often, even without the shift. Major-league infielders will convert most of them into outs, shift or not. Even without the shift, the league batted a combined .250 on grounders in the last three seasons.
- Line drives caught by infielders standing in shallow left/right field were more memorable because they were jarring. Those have been singles since the dawn of baseball. But when you stretch the data out to a full season, these instances really didn’t happen so often that the rule change is going to turn a .250 hitter into a .300 hitter.
- Hitters picked up quite a few cheap hits on poorly hit balls the opposite way, which effectively cancelled out some of the hits lost to the shift. This was noted by Baseball America when they analyzed why the Double-A shift ban didn’t have much of an effect in 2021, when the rule was partially put into place.
- These aren’t large sample sizes, which means some random variation was probably at play.
Conclusions
This analysis is hardly a prediction of what’s to come in 2023 and beyond, as there’s simply not enough data to make any definitive conclusions. But there are some interesting takeaways. It’s fairly clear that lefty batters will be the main benefactors of the shift ban, and ones who pull the ball and hit it hard are likely to see the biggest uptick in production. How much of an uptick will we see? That’s unclear. Based on the exercises above and the limited 2023 data so far, it likely won’t be monumental. In other words, the shift ban probably won’t usher in a mass return of .300 hitters. Today’s pitchers are still very difficult to hit. The shift ban hasn’t resulted in more balls in play, as the league-wide strikeout rate is roughly the same as it was in 2022.
Of course, hitters and pitchers will continue to adjust to the shift ban and other new rules as the year unfolds. Early on, though, there’s some promising evidence that eliminating the shift could at least cause a small increase in base hits, which is certainly not a bad thing.
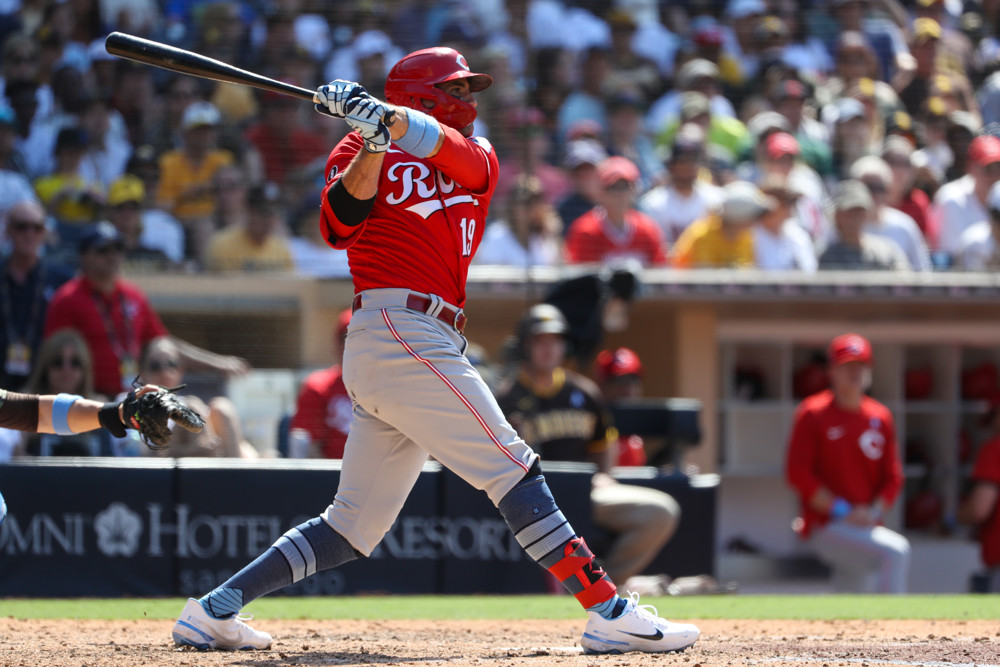
Featured photo by Kiyoshi Mio/Icon Sportswire

