
Much was made of the Reds’ athleticism as a team coming into the 2023 season. It certainly made sense. A look up and down the roster showed very little in the way of power but plenty of speed, especially compared to last year’s team. The plan was to try creating runs by being more aggressive on the basepaths. The team also believed that rule changes — including the pitch timer, limited pickoff moves, and bigger bases — would work to their advantage.
From a story in March by the Enquirer’s Bobby Nightengale:
“I think it’s pretty obvious we’re not going to be a heavy homer-hitting team, but there are so many more ways to manufacture runs than just by hitting home runs,” Reds outfielder TJ Friedl said. “Ball in the dirt and taking the extra base, first to third on a base hit, little things like that will add up to runs. That’s how we’re going to make an impact on the bases because we’re young, we’re athletic, we have a bunch of fast guys. That’s our strength.”
We’ve heard that from the Reds in spring training before and it never came to fruition. However, they are very much following through on their plan to be more aggressive in 2023. Is the approach yielding results? Let’s see what the data says.
The Runnin’ Reds
There’s no doubt the Reds are a more aggressive baserunning team than they’ve been in quite some time.
Steals are the most obvious evidence. The Reds are attempting more steals this year, as are most other teams in the game. There have been 1.78 steal attempts per game in 2023, up from 1.36 last year. Through only 48 games, the Reds have 35 stolen bases on 51 attempts — more than halfway to their 2022 totals (58 steals on 91 attempts) while barely over one-quarter of the way through the season.
Putting it on a per-game basis, the Reds are attempting to steal at nearly double last season’s rate:
- 2023: 1.06 attempts per game
- 2022: 0.56 attempts per game
Jonathan India leads the Reds in steals with eight, followed by Jake Fraley at six. T.J. Friedl and Nick Senzel also have four apiece. The MLB success rate on stolen base attempts is also up, from 75.4% to 78.7%, likely in no small part due to the rule changes. The Reds’ success rate has increased, too, from 63.7% to 68.6% — however, that ranks dead last in baseball. The Reds may be stealing more, but they’re also costing themselves runs (more on that later).
But baserunning is about more than steals, and there’s additional data to show how a team performs on the basepaths. Taking extra bases, and getting thrown out on the bases, also has a major impact.
The Reds have excelled in taking extra bases. Their 50% extra-base-taken rate trails only the Diamondbacks (51%) among all MLB teams. This metric measures the percentage of times a runner takes more than one base on a single or more than two bases on a double. The league average is 42%.
On the flip side, the Reds also have the most runners thrown out on the bases (19). This includes outs made on baserunning plays, such getting thrown out trying to advance from first to third on a hit or trying to score on a sacrifice fly. It does not include force outs, caught stealings, or pickoffs. Notably, the Reds are one of two teams that hasn’t made an out at home this year (the Giants are the other), although they’ve made an MLB-worst eight outs at third base.
So, where does that leave us? Is aggressiveness actually creating more runs?
When combining all the different ways baserunning can impact a game, are the Reds ultimately helping or hurting themselves with an aggressive approach?
Let’s turn to the composite baserunning measurements.
To start, we’ll look at how the Reds stack up according to FanGraphs’ comprehensive Baserunning (BsR) metric. Per the site, BsR is an “all-encompassing baserunning statistic that turns stolen bases, caught stealings, and other baserunning plays (taking extra bases, being thrown out on the bases, etc.) into runs above and below average.” Like similar stats, the league average is zero — anything higher is above average, and anything lower is below average.
Last year, the Reds were one of MLB’s worst baserunning teams, ranking 28th in BsR for the season (-15.6). Per FanGraphs, every “nine or 10” baserunning runs is equal to one win above replacement (WAR). So, the Reds lost about 1.5 WAR — more than a full win — from poor baserunning in 2022. This year, the Reds are above average with 2.9 BsR, which ranks eighth in baseball. The last time the Reds were an above-average team by BsR was 2015.
The best individual baserunners on the team by this metric are Friedl (2.3) and India (1.4). The worst are Tyler Stephenson (-2.2) and Henry Ramos (-0.9).
Baseball Prospectus has a similar baserunning metric, called Base Running Runs (BRR), that views the Reds even more favorably. The Reds currently lead baseball with 8.5 BRR. The next-closest teams are the Red Sox (7.3) and Diamondbacks (7.2), with a huge drop-off to the next team (Rays, 3.2). The Reds haven’t been an above-average baserunning team by this metric since 2016.
By BRR, India has been the top baserunner in MLB (3.1). The Reds’ other top baserunners are Kevin Newman (1.5) and Stuart Fairchild (1.1). Stephenson and Ramos again rate as the worst (-0.3).
Where are the Reds getting the most value on the bases?
When it comes to stolen base attempts, the Reds have hurt themselves more than they’ve helped. To add value from stolen bases, players/teams need a success rate of about 75% or higher. The Reds are well below that, ranking dead last in MLB.
Why does a team need to be successful at least three-quarters of the time? Because getting caught stealing is far more costly than a successful stolen base is beneficial. To help visualize this, here’s the league-wide run expectancy chart in each base/out situation from the 2021 and 2022 seasons:

Say there’s a runner on first base and no outs. Teams are expected to score 0.93 runs in those situations, based on the average of all previous outcomes. The runner breaks for second base. With a successful steal, the team’s run expectancy will rise to 1.16 (+0.23). An unsuccessful attempt would drop a team’s run expectancy for the inning to 0.28 (-0.65). So, a team would need three successful steals (+0.69 expected runs) to cancel out a caught stealing (-0.65 expected runs) in this situation.
If we total the change in run expectancy for each of the Reds’ successful steals this season, they’ve added 6.5 expected runs. But they’ve also lost 7.8 expected runs on their unsuccessful attempts, resulting in a net negative. Unsurprisingly, the Reds are second-from-last in Stolen Base Runs (-1.9) as measured by Baseball Prospectus; only the Pirates are worse.
Taking extra bases is where the Reds are creating the most value. Baseball Prospectus measures this in four ways: Hit Advancement Runs (taking extra bases on hits), Ground Advancement Runs (e.g., advancing from second to third or third to home on a groundout), Air Advancement Runs (e.g., tagging up on a flyball), and Other Advancement Runs (events that aren’t captured in the other metrics, such as advancing on wild pitches or passed balls).
Here’s how the Reds rank in those metrics:
- HAR (5.1): 1st
- GAR (5.0): 1st
- AAR (0.1): 14th
- OAR (0.1): T-8th
The Reds are gaining most of their baserunning value by taking extra bases on singles and doubles. They’ve created two times the value of the next-closest team in HAR, which is the Braves at 2.5. India has led the charge in this department, gaining 2.4 HAR this season. That number leads baseball by a healthy margin; the next-closest players are Trea Turner, Nico Hoerner, and Geraldo Perdomo at 1.3 HAR. India’s aggressiveness, along with his general ability to get on base at the top of the lineup, is a large reason why he ranks sixth among major-leaguers in runs this season (38).
Cincinnati is also creating a lot of value by advancing on ground balls, and a smaller amount of value by advancing on flyballs, wild pitches, and passed balls.
Final Thoughts
It’s exciting to watch players take extra bases. When done smartly, it can also help a team gain a small edge over opponents. As the league starts to steal more bases again, the Reds have still been more aggressive than most other MLB teams. This has helped them squeeze out some extra runs from a lineup that lacks thump.
The Reds rank 19th in baseball with 4.29 runs scored per game. That’s below average (4.57), but it’s still notable considering how little power the team has hit for (28th in HR, 27th in ISO). Teams that are bad in both departments can really struggle to score runs. For example, the Marlins are dead-last in runs per game and they rank 26th in ISO, 24th in HR, 28th in BsR, and 27th in BRR.
The impact of taking an extra base isn’t as substantial as hitting a home run, of course. Small ball can only go so far. A home run is about 10 times as valuable as a stolen base in terms of run creation, for example. Unquestionably, a team playing in the most homer-friendly stadium in baseball, Great American Ball Park, should be posting better power numbers.
But it’s also true that the Reds are gaining positive value with their aggressiveness on the bases. Yes, there are times the Reds have run themselves out of innings, and their stolen-base efficiency leaves a lot to be desired. Overall, though, they’ve created more runs than they’ve lost by being aggressive. As long as the Reds are smart about the chances they take, continuing this approach could be a good way to get the most out of an offense with obvious flaws.
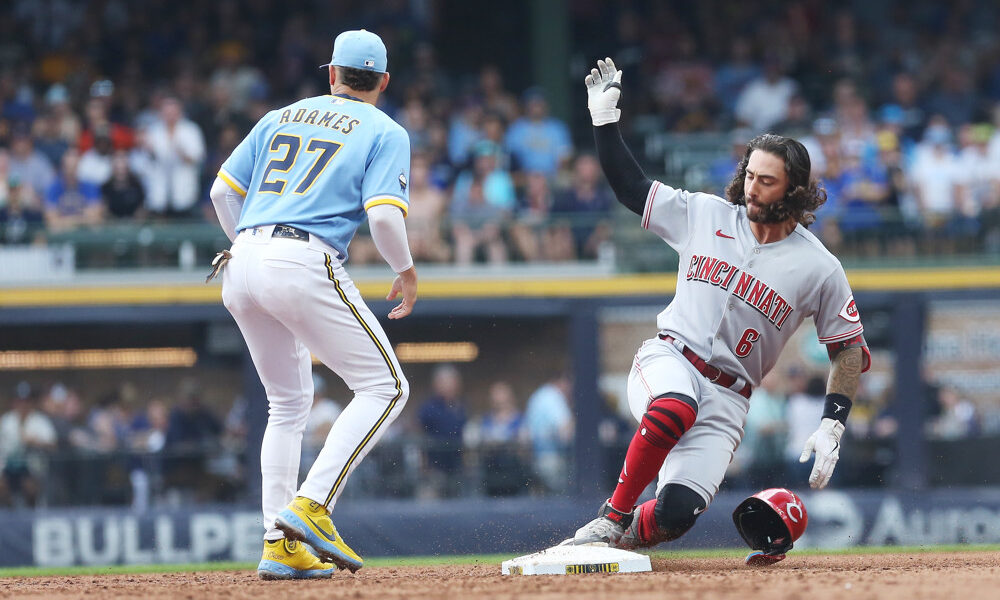
Photo by Larry Radloff/Icon Sportswire

