
Welcome to Red Monday, where Reds fans can start their week with clear-eyed analysis of how the team is doing and where it’s headed.

The Week That Was
The Reds were 4-2 last week and are now 18-22 overall.
The Reds began the week taking two of three from the slumping New York Mets.
- Monday The Reds jumped out to a 7-1 lead and then held on to win the series opener 7-6. TJ Friedl, Jonathan India and Nick Senzel (batting second) were the biggest bats. Alexis Diaz got the final four outs to earn his seventh save.
- Tuesday The Reds were overmatched by the Mets quality arms: Justin Verlander, Adam Ottavino and David Robertson. 2-1 loss.
- Wednesday The Reds offense got five runs off Mets starter Kodai Senga and the bullpen — Derek Law (1. IP), Ben Lively (3 IP), Lucas Sims (1.2 IP) and Kevin Herget (3.0) — came through with a shutout performance as the Reds won the series rubber match 5-0. Spencer Steer hit his fifth homer.
David Bell’s team traveled to South Beach for a three-game series against the Marlins.
- Friday Behind a solid start from Graham Ashcraft and two homers from Jake Fraley, the Reds overcame a series of awful defensive plays and a two-run Marlins lead to take the first game in Miami 7-4.
- Saturday The Reds won a wild back-and-forth game 6-5. Jake Fraley homered again and drove in four runs. Levi Stoudt threw an acceptable three innings on short notice. The Reds bullpen bent (Ian Gibaut, Buck Farmer and Alexis Diaz each giving up a run) but didn’t break.
- Sunday The Reds dropped the series finale 3-1. Luke Weaver had a terrific start but terrible, awful defense made it shorter than it needed to be. New arrivals in the bullpen gave up two runs. The bats were quiet.
Incoming
- Three-game series in Colorado against the Rockies (8:40, 8:40, 3:10)
- Thursday: off
- Three home games with the New York Yankees (6:40, 4:10, 11:35)
Measuring Up To Expectations
Suppose you’ve been assigned to attend a ballgame to scout two baseball players for their ability to hit. You arrive to the park and settle into your seat. The first player hits a line drive into the outfield gap that the centerfielder breaks early on and catches as he dives to the ground. The second player hits a soft ground ball that finds a hole between the third baseman and shortstop.
Here’s the catch. Suppose those were the only two plate appearances you could see and had to base your report on them alone and nothing else. The first guy went 0-1, the second was 1-1. Which one do you recommend to your team? Easy. The guy who hit the gap shot.
You value the quality of contact made over the actual scorebook result.
Thanks to the Hawk-Eye Statcast system installed in every MLB park, we’ve had data that provides an accurate measure of contact quality. It lets us see through the vagaries of defense, park size, where balls land, official scoring, etc.
Even better, the folks who process that info put it into statistical form that lets us relate it to old-fashioned scorebook stats. Instead of batting average (BA) we can see what the batter would have batted were the results of his contact quality typical. It’s called expected batting average (xBA). Instead of isolated power (ISO) which we could measure based on scorebook results, we have xISO which gives us an accurate measure of power assuming average results from the actual contact quality.
Let’s put those “expected” stats to work analyzing the Reds offense.
We’re a quarter of the way into the 2023 season. Sample sizes are large enough to give us a reliable measure of how batters have hit so far, though not necessarily how they will hit going forward. But the number of plate appearances is still few enough that luck on balls-in-play, defense and park dimensions can significantly skew public-facing stats. So let’s take a closer look at the Reds lineup in terms of hit skill, hitting for power and overall run production. [Stats through Saturday.]
Batting Average The average MLB batting average (BA) is .247. The first data column in the chart below lists the Reds position players in order based on BA. Five hitters — Friedl, India, Fraley, Stephenson and Senzel — are above league average.
The second data column shows each player’s expected batting average xBA. That’s what the player would be batting if you assume he had typical results on balls in play. It factors out the variance — defensive positions, defensive play, where the ball lands, official scoring, etc. — that is largely outside the batter’s control.
The far right column shows the difference between the player’s BA and xBA. Negative numbers mean the player’s actual quality of contact falls short of what he’s put in the scorebook. Red numbers mean the opposite, that he’s been unlucky.
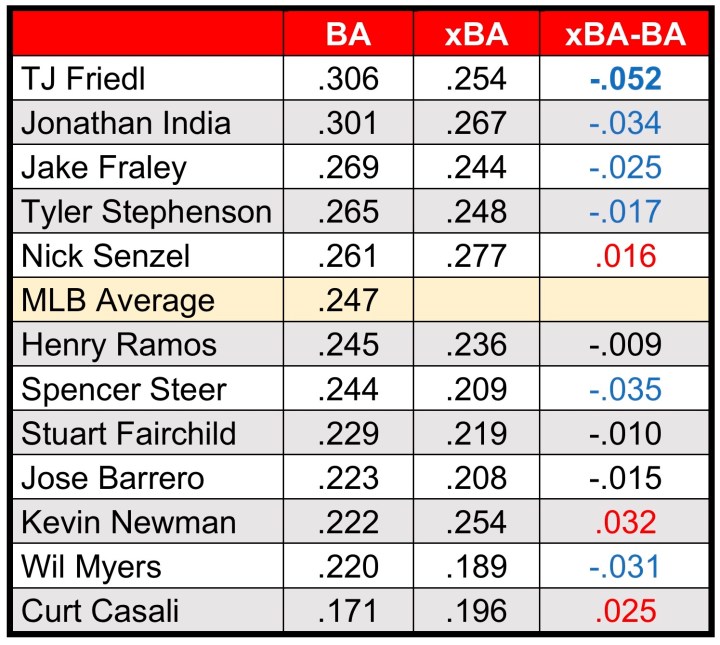
One phenomenon you’ll see with charts like these is that players are more similar to each other in “expected” hitting than “actual” hitting. Lucky players move toward the top, unlucky players move toward the bottom. So when you eliminate luck, the players tend to bunch closer together. In other words, players are more alike than their public-facing stats show. There are exceptions.
Nick Senzel sits at the top of the Reds xBA list, a full 30 points above league average. On the other hand, TJ Friedl is due for a major regression to the league mean, although his xBA is still above average. Same with Jonathan India. Spencer Steer and Wil Myers are below-average hitters by BA who fall even farther in xBA. Kevin Newman joins the “above average” list and Jake Fraley falls slightly below.
Hitting for Power The second chart is the same as the first except it deals with hitting for power instead of batting average. Average league isolated power (ISO) is .159. ISO simply tells us the average number of extra bases the player gets per at bat. Last year’s high ISO was .375 (Aaron Judge). Second was (.306) Yordan Alvarez. Brandon Drury (.246) led the Reds last year.
The 2023 Reds have three players who have hit for above average power — Steer, Fraley, Friedl.
Add park dimensions to the list of variance factors when it comes to power stats. Like with batting average, ISO shows what’s in the scorebook, xISO shows the player’s ISO with typical outcomes for actual quality of contact.

Again, the players at the top tend to adjust downward with “expected” numbers and vice versa and players are more similar than their variance-influenced stats show.
In the Reds case, Spencer Steer has been their strongest hitter for power. In fact, he’s the only Reds player with above-average power when accounting for variance. Jake Fraley and Jonathan India are just below average. Stuart Fairchild and Tyler Stephenson are a bit below them. TJ Friedl seems headed for another big drop.
Overall Run Production The stat wRC+ is a composite of all player at bats, including strikeouts and walks. It’s weighted for the average run creation of each actual scorebook outcome. So wRC+ accounts for hit skill, on-base skill and hitting for power. It’s similar to wOBA except wRC+ is put on a whole-number scale with 100 as average.

Let’s start with the first column. India, Fraley and Friedl are above average. Steer, Fairchild, Senzel and Stephenson are close to average. From Ramos down, wRC+ drops sharply.
If we adjust the Reds’ wRC+ to account for quality of contact instead of actual result of the play, you’d get a stat like xwRC+. Again, note the smoothing effect. The players at the very bottom haven’t been as bad as their outcomes indicate. Same averaging effect with the guys at the top.
Adjusting for quality of contact, India, Fraley, Senzel and Fairchild (!) are above average. Stephenson, Steer and Ramos have been below average, but close. TJ Friedl has been extremely fortunate on balls in play so far, due for a major downward regression. At the opposite end, Newman and Casali are due for positive regression. Wil Myers has been dreadful no matter how you measure.
Bottom Line The Reds stats — both actual and expected — show the team for the most part is below-average in hitting. We knew that. The Reds’ team wRC+ is 86 and ranks 27th out of 30 major league teams. Looking at quality of contact (xwOBA) the team drops to last.
The charts above also give an indication where the problems are and why the Reds might benefit from calling up several players from Louisville.
Bullpen Items
The Sims Effect Lucas Sims has appeared in eleven games for the Reds in 2023. He’s allowed no earn runs and only two hits. We’ve talked about his super spin rates. Check out the data:

All three of Sims pitches show significantly higher spin rates than 2022 and are in the top few percentile spin rates. Sims’ slider, which he throws on 52 percent of his pitches, has the highest spin rate in the majors.
Beyond his own innings, the Reds bullpen has been more effective since Sims joined the team on April 19. Sims began the season on the IL due to back spasms that plagued him in 2022. Before Sims returned, the Reds bullpen had an ERA of 4.19. Adding a second reliable arm in the back of the pen has stabilized the relief corps. Their ERA has dropped to 2.80 since Sims’ return.
Meet Alan Busenitz The Reds made a series of roster moves yesterday including calling up right-handed reliever Alan Busenitz. The 32-year-old Busenitz was a 25th-round draft pick of the LA Angels in 2013. Busenitz spent many years in the Angels minor league organization and several more with the Twins. He appeared in relief for the Twins in 50+ games over the 2017 and 2018 seasons, posting a 5+ ERA and xFIP. He spent the last four seasons pitching for the Rakuten Golden Eagles in Japan’s Nippon Professional Baseball Pacific League.
The Reds signed him to a minor league deal in January. He’s appeared in 15 games for the Triple-A Louisville Bats. Busenitz got in the game yesterday and threw 19 pitches. His four-seam fastball averaged 95 mph and he threw a 92 mph cutter. Busenitz gave up three hits and a walk in 0.2 innings.
Meet Silvino Bracho The Reds also called up Silvino Bracho, another right-handed reliever. Bracho is 30 years old and has pitched in six other MLB seasons, mostly for Arizona plus three games last year for Atlanta. Bracho gave up this home run shot heard round the world in the World Baseball Classic.
Bracho’s career ERA is 4.88 and career xFIP is 4.61. The Reds signed him last December. Bracho also got into yesterday’s game and threw 14 pitches. He features a 92.5-mph fastball, 81.5-mph changeup and an 80-mph slider.
In Case You Missed It
The Dayton Dragons produce excellent content. Here is Around the Horn with Edwin Arroyo, prized shortstop acquired in the Luis Castillo trade.
[Image: MLB]

