
Once a pitcher throws the ball, they have little control over what happens if it’s put into play. Although pitchers have at least a little bit of influence over a hitter’s quality of contact through velocity and pitch movement, they’re often at the mercy of their defense once the ball leaves the bat.
This is one the pitfalls of ERA and why metrics such as FIP (Fielding Independent Pitching), xFIP (Expected Fielding Independent Pitching), and SIERA (Skill Interactive ERA) are useful. These ERA “estimators” attempt to take defense and luck out of the equation and measure what a pitcher can directly control (strikeouts, walks, and hit batters).
The 2023 Reds are a perfect example of why these metrics are helpful. When looking only at ERA, the Cincinnati pitching staff is lousy, ranking 26th in baseball (5.05). And it’s true that some pitchers on the club have not performed well. But ERA doesn’t tell the whole story. The Reds have a FIP (4.31), xFIP (4.25), and SIERA (4.14) that are all almost a full run lower than their ERA. All three of those marks are better than league average. There’s probably some degree of luck involved in the gap between the Reds’ ERA and the peripheral numbers — but a big culprit is poor defense.
Diving into the Reds’ defensive struggles
Here are the teams with the biggest gaps (average difference between ERA and FIP/xFIP/SIERA), along with some key defensive metrics (DRS, OAA) through Monday’s games:

(We’ll briefly pause here so you can pick your jaw up off the floor after seeing how terrible the A’s have been any way you slice it.)
A main theme here is bad defense. Aside from the Royals, each of those teams ranks very poorly in at least one defensive metric.
On the flip side, many of the teams with strong ERAs despite subpar peripherals have excellent defenses. The Brewers have a team FIP, xFIP, and SIERA almost a full run higher than their actual ERA. While they may be due for some regression, they benefit tremendously by having one of the best defensive teams in the game (25 DRS, 5 OAA).
As a team, the Reds are 29th in defensive runs saved (DRS) and 27th in outs above average (OAA). But it’s not a team-wide issue. The outfield has actually been respectable (2 DRS, -1 OAA), led by T.J. Friedl (3 DRS, 1 OAA). Most of the poor defensive play has come from the infield.
There have been errors — 13 of them — but the biggest problem is a lack of range and failing to convert grounders, both routine and non-routine, into outs. Per Sports Info Solutions, no team in baseball has converted a lower percentage of ground balls into outs than the Reds. Through Tuesday’s games, the Cincinnati infield is tied for the worst OAA (-10) in baseball. They’re also dead last in DRS (-20). This isn’t a new issue for the Reds, even as their personnel has changed. Since 2020, no team has had a lower infield OAA (-58) and only the Phillies have a worse DRS than the Reds (-69).
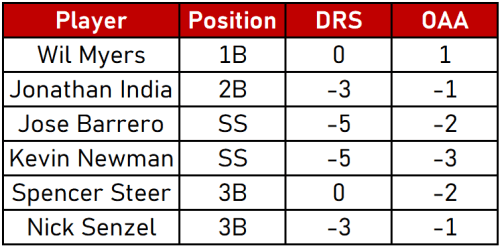
This year, no infielder with 50+ innings at one position has been above average in either metric, aside from Wil Myers at first base.
Poor infield defense has proven costly in many games through the first month of the season. It has extended innings for opposing teams. It has resulted in elevated pitch counts and earlier exits for Reds starting pitchers. And it has helped lead to losses. You can probably think of several examples off the top of your head.
Some are more blatant, such as the error by José Barrero that led directly to a loss against the Pirates on April 21, as it allowed the go-ahead run to score late in a tie game. More recently, Hunter Greene saw his pitch count elevated due to defensive gaffes in the second inning against the A’s (an error by Nick Senzel at third base, as well as a misplay in right field by Henry Ramos).
Other mistakes don’t show up as errors in the box score, but they’re still costly, such as this ill-advised decision by Spencer Steer to try tagging a runner between second and third base instead of throwing to first. Many subpar defensive plays are hard to notice because they look like regular hits — but they only become hits because the fielder didn’t get to a ball that most others do. Over time, these negative plays add up.
Some Reds pitchers have been hurt by the lackluster defense more than others. Baseball Savant allows us to isolate which pitchers have had the worst infield defense behind them. Behold:

These numbers partly help to explain the massive difference in BABIP (batting average on balls in play) between pitchers. The pitchers who’ve had the best infield defense behind them, Graham Ashcraft and Buck Farmer, have a .243 and .216 BABIP, respectively. Meanwhile, Alex Young is at .344, Hunter Greene is at .394, and Nick Lodolo is at an MLB high of .450. Other factors come into play, such as contact quality allowed, but defense can certainly affect a pitcher’s BABIP and result in a domino effect through runs allowed (or prevented).
What about the catchers?
While catching defense is not included in OAA, it is in DRS. The Reds are also slightly below average there (-1 DRS), with all of the negative value being driven by Tyler Stephenson (-3). Using the metrics Statcast does provide, we can break down catching defense a few ways: pitch blocking, framing, and throwing out basestealers.
Here’s where the Reds catchers fall in blocking, framing, and throwing runs above average:

Searching for positives
The good news is that it’s still early in the season, and defensive metrics take a while to stabilize. A few bad plays can adversely affect a player’s DRS or OAA, and it can take time to make up ground. The bad news is that the eye test, for the most part, confirms the unsightly numbers.
If you’re looking for silver linings:
- Kevin Newman is far from an elite defender at shortstop, but he’s better than he’s shown so far — and needs to be to provide value. From 2020 to 2022, he was roughly average (1 OAA, 2 DRS) with the Pirates.
- When healthy, Wil Myers has been a fine fill-in at first base.
- Despite the lapses, Barrero has been regarded by scouts as a plus shortstop for most of his pro career and has shown flashes of that at the big-league level. There is at least hope for improvement with him.
- While eye tests can be deceiving, Senzel has looked comfortable at third base and should hopefully continue to improve there as he gets reacclimated to his natural position. Remember, he’s only played 15 games at third base in the big leagues. This is his first year playing the position regularly since 2018.
Looking ahead
In the long run, the Reds will have some interesting decisions to make about who will occupy each infield position.
Can Jonathan India stick at second base when he has ranked as a poor defender at the position over the last three seasons? Where will Steer ultimately play? What is Barrero’s eventual role with Matt McLain and Elly De La Cruz hot on his heels for the big-league shortstop job? Who is the long-term first baseman?
While those answers aren’t clear yet, one thing is: the Reds have to get better defensively across the infield as they hope to transition from rebuilding to contending.
Featured photo by Laura Nawrocik

