
In 2013, Reds prospect Jesse Winker — then 20 years old — won the Midwest League Home Run Derby as a member of the Dayton Dragons. He would go on to hit 16 home runs that season, his first full year as a professional after being drafted 49th overall by the Reds the previous summer. Most scouts and prospect gurus didn’t expect 40-homer seasons from Winker as he got older, but all noted that he had power to grow into.
But as he went through the farm system, reports seemed to sour on Winker’s power.
In 2015, he hit 13 home runs in Double-A Pensacola with a career-low .433 slugging percentage and .151 isolated power (ISO). This came after an injured wrist ended his 2014 season early. Additionally, his home ballpark was notorious for sapping left-handed power due to the way the wind blew in from Pensacola Bay. Winker injured his wrist again in 2016, forcing him to miss time and further sapping his power numbers. Although he hit a healthy .308/.402/.402 in Triple-A Louisville, he hit only five home runs.
Given that there were clear causes for Winker’s dip in power (home ballpark and injury), it seemed puzzling that prospect evaluators continued to ding him for it. MLB Pipeline gave Winker 45-grade power — barely above average — in 2017, down from 55 in 2014. Some, like John Sickels, felt Winker’s body would allow him to hit for more power, but he was more of a doubles hitter because he hit a lot of line drives.
When Winker was called up to the Reds in 2017, it seemed he was putting those questions to rest. He hit seven home runs (along with seven doubles) in 137 plate appearances, good for a .529 SLG and .231 ISO.
The next season, it looked like the prospect evaluators may be right after all. Winker again hit seven homers — but in 334 plate appearances this time (.431 SLG, .132 ISO). Lurking in the shadows, however, was improved contact quality. His average exit velocity jumped by nearly 3 mph to 90.9 mph, and his hard-hit rate jumped by nearly 10 points to 42.2%. A deeper dive showed even more potential. His maximum exit velocity was 114.1 mph, which ranked 38th among hitters with at least 200 batted balls. His maximum was 107.2 mph in 2017. Maximum exit velocity may seem useless because it’s a single data point, but it has some usefulness when evaluating a player’s true ceiling, as FanGraphs Alex Chamberlain wrote.
In 2019, the pendulum swung back the other way. Although he sacrificed a bit of contact and plate discipline skills, he hit 16 homers in 384 plate appearances, resulting in a .473 slugging percentage and .204 ISO. But he was far from a Statcast darling. Although he started off the season hitting the ball hard, he ended it ranked in the 50th percentile in exit velocity (89.2 mph), 63rd in hard-hit rate (41.1%), and 18th in barrel rate (4.3%). His maximum exit velocity was 110.8 mph, which ranked a middling 145th in baseball. Although he did hit for more power, his batting average (.269) and walk rate (9.9%) fell to career-lows, which resulted in a career-worst 113 wRC+. An injury again slowed him down; this time, it was a neck strain.
Heading into 2020, Winker was established as an above-average hitter against right-handed pitchers. But would there ever be more to his game? 2020 proved that there would.
At age 26, Winker had a career year in what was, unfortunately, a shortened season. He hit .255/.388/.544 with 12 home runs in only 183 plate appearances. He also drew a career-best 15.3% walk rate. It all contributed to his team-leading 146 wRC+. That ranked 24th among MLB hitters with at least 180 trips to the plate.
But the power was what really stood out compared to previous years. Winker’s slugging percentage and ISO (.289) were both in the top 25 in baseball. Here were his quality of contact metrics and percentile ranks:

Winker’s increase in hard-hit rate between 2019 and 2020 ranked 20th among all batters. Only seven hitters added more exit velocity. And not a single hitter in baseball increased their barrel rate by more. He also showed off that exit velocity ceiling again by topping out at 113.0 mph, 34th-best in baseball.
How did he make such a big leap?
Quite often, players see a jump in power numbers when they start pulling the ball more. Indeed, Winker did just that in 2020. He increased his pull rate from 36.0% to 44.2% year over year, the 21st-largest jump in baseball. Even more specifically, Winker started pulling the ball in the air more often. He pulled only 19.9% of his pop-ups, flyballs, and line drives in 2019, which ranked 279th out of 305 hitters who hit at least 100 balls in the air. That number jumped to 38.9% last season, 28th out of 230 hitters with 50+ batted balls in the air.
The spray charts tell the story (2019 on the left, 2020 on the right):

As the chart shows, Winker was still more than capable of hitting opposite field bombs. But pulling the ball more often increased the frequency of said bombs. A jump in average launch angle from 7.2 to 10.5 degrees probably didn’t hurt either.
Winker seemingly owes some credit to a change in batting stance. At the beginning of 2019, he started in a fairly crouched position. In 2020, he had less bend in his knees, leaned back, and deployed a slightly more open stance.
Take a look (2019 on the left, 2020 on the right):

Standing more upright could be what helped him tap into harder contact and more power. It’s similar to what Joey Votto did after his “benching” in 2020 and is continuing into this year’s spring training. Opening up the stance and leaning back could be what Winker did to help himself pull the ball at a higher rate.
This shift toward a power-oriented approach did cost Winker some strikeouts. Between 2017 and 2019, Winker maintained at 15.2% strikeout rate — much better than league average, which was between 21.6% and 23.0% during that time. His strikeout rate skyrocketed to 25.1% in 2020, worse than league average (23.4%). His whiff rate (28.9%) was, unsurprisingly, the highest of his career as well, with the biggest increases coming against fastballs and breaking balls. The strikeouts were ultimately a worthwhile trade-off for an increase in overall production; remember, his wRC+ rose from 113 to 146. But this will be something to monitor in 2021. Can Winker bring down the strikeouts toward his career average while maintaining his gains in power? If so, he could potentially tap into another level.
In terms of selectivity, Winker’s plate discipline didn’t change much. His chase rate, which has always been much better than the average hitter, decreased from 2019. His overall swing rate did, too. Winker was seemingly being more selective at the plate — minus one exception: first pitches. His first-pitch swing rate, consistently between 22-24% in the first three years of his career, jumped to 30.1%. The explanation for this could be twofold:
- Looking to get ahead in the count right away, pitchers may groove the first pitch of the at-bat right down the middle.
- Winker, known as a patient hitter, wanted to ambush pitchers who thought they could get away with a hittable first pitch because he wouldn’t swing.
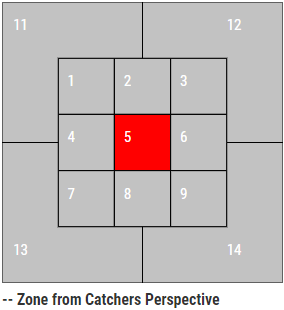
Statcast defines a pitch thrown right down the middle of the plate as a “meatball.” It’s defined as zone 5 in this graphic. Aside from times when hitters are ahead in the count, the first pitch is when they’re most likely to get a meatball. Here’s the data from the last five seasons:

While hacking on the first pitch all the time is ill-advised, doing it here and there can yield good results. Winker hit .353, slugged .765, and wOBA’d .476 when he put the first pitch into play in 2020. He ranked better than league average in all three metrics (.343 AVG, .597 SLG, .398 wOBA).
This change in first-pitch aggressiveness is something else he shared with Votto, another hitter who is otherwise among the most patient in the game. Back in 2017 and 2018, Votto swung at 36.1% of first pitches, the 21st-highest rate among batters with 1,000+ plate appearances during that time.
Notably, Winker was also more aggressive when swinging at meatballs in general. His meatball swing rate — which stayed consistent at 76% his whole career — jumped to 82.6% in 2020. It should come as no surprise that Winker did a ton of damage in that zone:

In a year full of disappointing performances at the plate for the Reds, Winker was the clear bright spot. The 60-game sample size caveat obviously applies, but he made clear changes to his stance and approach at the plate that led to his drastic improvements. It wasn’t just variance in a small sample size.
As many scouts felt he would do early in his professional career, Winker tapped into the raw power of his 6-foot-3, 215-pound frame and went from a line-drive hitter to a home-run threat. Let’s just hope we get to see it for a full season in 2021.
Featured photo by Larry Radloff/Icon Sportswire


The Meatball chart is fabulous. My own theory, which follows the logic that home runs are thrown and not hit, is that a pitcher’s defining characteristic is his propensity to thrown Cruddy Pitches, which I define as in or near the meatball zone, at hitting speed. It can be a hanging change/breaking ball, or a mediocre fastball, or anything that Bronson Arroyo threw to left-handed hitters. Major league hitters pretty much all kill Cruddy Pitches. Even Darrell Chaney could hit a Cruddy Pitch.
He who throws a lot of Cruddy Pitches makes less money than he who doesn’t.
The Meatball chart also shows how important the first pitch is in every count. Analytics on this topic tends to be a nuanced explanation of the Ted Williams axiom: “Get a good pitch to hit.”