
Baseball is back. Well, almost. The report date for Reds pitchers and catchers is a week from today. That’s a Valentine’s Day gift. The team’s full squad is due to report the next Monday. The first spring training game takes place Saturday, February 24 against the Cleveland Guardians. It can’t come soon enough.
Reds President of Baseball Operations, Nick Krall, has been active this offseason. Krall is building off a successful 2023 season when the Reds improved by 20 wins over 2022, finishing 82-80. That record was good for third in the NL Central. It fell short of the final NL Wild Card slot by two games.
The Reds have added players across their roster. Frankie Montas (30) should make the starting rotation. Jeimar Candelario (30) looks to be a regular in the Reds infield, mostly at first base. Nick Martinez (33) can swing between the rotation and bullpen, though his stats point toward Martinez being better suited for the relief corps. The club also added veteran bullpen arms Emilio Pagan (33) and Brent Suter (34), while also bringing back Buck Farmer (32).
The central question, as it is for every Major League team, is did the front office do enough?
If you talk to fellow fans or read Reds social media, you’ll find answers to that varying from one end of the optimism scale to the other, depending on the thickness of the source’s rose-colored glasses.
Beyond fan opinions, we’re starting to see expert projections for win-loss records across the league. As of today, FanGraphs projected these W/L standings in the NL Central (number of wins):
- STL (83.4)
- CHC (80.5)
- MIL (80.2)
- CIN (78.7)
- PIT (77.0)
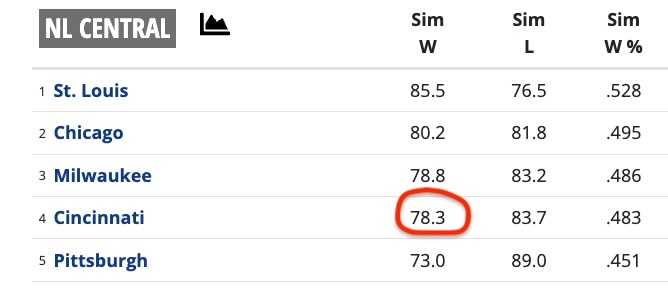
Likewise, the folks at Baseball-Prospected published this projection today:
- STL (85.5)
- CHC (80.2)
- MIL (78.8)
- CIN (78.3)
- PIT (73.0)
There’s a lot of similarity. Both groups have the Reds finishing fourth in the division, with about 78 wins.
It would be reasonable for a Reds fan staring at those numbers to ask the following question:
Given all the solid players the Reds have added and all the ones from the first couple months of last year that the club ditched, how can these so-called experts think the Reds will be worse this year than last?
Like I said, that’s a fair question.
Before we get into possible explanations for how the Reds could have a better team and end up with a worse record, let’s discuss those projections.
About The Projections
It’s normal for fans to be skeptical of sources like FanGraphs or Baseball Prospectus when we see they don’t share our optimism. A well-established form of biased thinking is called “confirmation bias” where we tend to favor information that confirms our own beliefs. It’s fun as fans to speculate (or pontificate, depending on the podcast) about how our players will perform. We’re all guilty of wishful thinking in varying degrees about our teams.
But confirmation bias is known as bias for a reason. When experts, people who do this for a living, seem to be saying the same things, we stick our heads in the sand at our own ignorance.
Unlike we fans, FanGraphs and Baseball Prospectus, are objective. Sure, they make mistakes. They would be the first to admit it and talk about error ranges. Baseball Prospectus projects the Reds to win 78 games but also gives the team a 12.5% chance of winning the division. You can call it an error bar or uncertainty level, but they put it right up front. So, it’s not the newsflash critics think it is by pointing out the projections are often wrong.
And their errors are not systematic. They’re as likely to be too high as too low. Players get better during the year or worse. They get hurt or stay healthier than ever. Those are factors that defy accurate projection. The experts publish midranges as they see it.
FanGraphs and Baseball Prospectus also have all the information and then some. They run their programs hundreds of times to find averages. For instance, the ZiPS system, which is part of the basis for the FanGraphs projection, considers player comps all the way back through the 1950s! In that context, it’s hilarious to see the know-it-all critic on Twitter who says “yeah, but Paul Goldschmidt is 36” as though sophisticated projection systems are unaware of that.
Whatever flaws these expert sources have, it’s not that you or I have more information than they do. We have about eleventy billion times less. They figure out projections for every player on every team based on comparable players from the past. From that data they calculate win-loss percentages down to several decimal points.
Let’s get back to explanations for what they’re saying about the Reds being worse this year than last year.
Better Hitting, Worse Outcomes
In 2023, the Reds had a significant number of important players who had much better outcomes than average based on how they hit the ball. You can measure this kind of “luck” by looking at metrics like average exit velocity and batting average on balls in play (BABIP) and comparing those numbers for specific players to league and their own career averages.
A simple way to identify whether players were lucky or unlucky in that sense is to compare their wOBA (weighted on-base average) with their xwOBA (expected weighted on base average). The first (wOBA) is the actual outcome of at bats based on the balls falling where they did, plus home runs and walks. The second (xwOBA) is based on the typical or average outcome of balls struck in that certain way. A player whose xwOBA is much higher than his xOBA could be considered lucky. He didn’t hit the ball that well but the hits fell in. And vice versa.
Many of the Reds players had normal, small gaps between their wOBA and xwOBA. Jake Fraley, Jonathan India, Tyler Stephenson, Christian Encarnacion-Strand, Elly De La Cruz and Stuart Fairchild all had gaps smaller than 10 points, one direction or another.
But four Reds players had enormous gaps, with an xwOBA much lower than their wOBA.
- TJ Friedl (.290/.353)
- Matt McLain (.332/.370)
- Spencer Steer (.331/.355)
- Will Benson (.323/.369)
And Noelvi Marte had a medium-sized gap (.342/.357).
For example, that means if you look at all the batted balls TJ Friedl actually hit last year, the typical result, using data from every other player in the league, would be a wOBA of .290. Friedl’s wOBA was .353, more than sixty points higher.
When projection programs estimate what a player’s wOBA will be in 2024, the xwOBA from 2023 gets a lot of weight. For instance, FanGraphs is projecting Matt McLain’s 2024 wOBA at .341. Note: That’s an improvement over how he actually hit the ball in 2023. Likewise, Friedl is projected at .331, Steer at .340, Benson at .329.
Again, please understand, FanGraphs is projecting each of those players to hit the ball better than last year. But when you factor out the luck by looking at typical outcomes for balls in play, their results in 2024 won’t be as good as they were in 2023.
Usually, wOBA/xwOBA gaps are small and randomly distributed on a team. After all, xwOBA is based on the average across the league. But in 2023, the Reds had a large group of important players on one side.
Also noteworthy: The one starting position player the Reds have acquired falls into the same category. Candelario had a .346 wOBA last year but only a .319 xwOBA. He’s projected at .339.
That’s an explanation for why sophisticated projection systems could believe the young Reds team will hit the ball better than last year but still score fewer runs.
Run Differential Baseline
A team’s run differential looks at how many runs it scored (RS) compared to how many runs it allowed (RA). Over the course of a season, those numbers will offer a quick, rough estimate of how many games a team should win. Teams where RS = RA can be expected to be around a .500 team.
Last season, the Reds scored 783 runs and allowed 821. Based on a common formula, a team with that run differential would expect to be 77-85. The Reds win total exceeded that by five games. Most analysts see that as being at the lucky end of a random distribution.
For another example, the Cardinals run differential was 719-829, projecting exactly their actual record of 71-91. The Cubs were 83-79 with an expected W/L of 90-72 based on their run differential. The Brewers were 92-70 with expected W/L of 90-72.
The new Baseball Prospectus projection puts the 2024 Reds at 795 runs scored and 829 runs allowed. That’s essentially the same run differential size as last year (38 vs. 34). A few more runs scored but also a few more runs allowed.
The RA number may seem questionable since the Reds pitching was so poor last year and thought to be better this summer.
But the Reds pitching isn’t that solid, particularly the bullpen. Here are projected ERAs for expected bullpen members: Diaz (4.11), Martinez (4.35), Pagan (4.58), Sims (4.84), Suter (4.65), Gibaut (4.60), Moll (4.46), Farmer (4.88) and Young (4.71). Those numbers put the Reds bullpen near the bottom of MLB.
As for the rotation, it doesn’t project much better: Greene (4.28), Ashcraft (4.81), Montes (4.53), Abbott (4.40) and Lodolo (4.17). Several of those starters have spotty health records or recent concerns. The next options to fill vacancies are: Williamson (5.12), Phillips (4.66) and Martinez with a career ERA 1.5 points higher as a starter than reliever.
Further, Runs Allowed is also a function of team defense, so the projection systems may be factoring in the Reds poor defense as well.
So, once again, these projection systems don’t see the Reds being a worse team. Their run differential is expected to be about the same. But projections assume neutral luck, which would put the Reds a handful of games lower in terms of W/L.
The Cardinals Jump
The team with the biggest expected jump based on the 2024 projections is St. Louis. The Cardinals are projected to flip their run differential from -110 runs to +32. They are expected to add 60 runs of offense and subtract a whopping 82 runs allowed (pitching and defense).
On offense, seven Cardinals position players had wOBA < xwOBA gaps of more than 10 points. So where the Reds were “lucky” in 2023, the Cardinals were unlucky.
St. Louis acquired starting pitchers Sonny Gray (3.70), Lance Lynn (4.40) and Kyle Gibson (4.41), who are each projected to throw 175 innings. Gray adds a top tier starter to their rotation. Lynn and Gibson are league average. They added Kenyan Middleton (3.93) and Andrew Kittredge (4.04) to an already strong bullpen. A half-dozen Cardinals relievers are projected with better ERAs than Alexis Diaz (4.11).
But We Ditched All Those Bad Players
One common belief among Reds fans who are projecting more wins in 2024 is that the Reds have to be better this year because of all the below-average players they replaced on their roster as the season went on. They point to all the at bats given to players like Wil Myers, Kevin Newman and Jose Barrero and all the innings pitched from the likes of Luke Weaver and Luis Cessa.
The problem with that line of thinking is the Reds over-achieved with those players. Would it surprise you to learn the Reds had a better record in March-April-May than they did in August-September-October?
Well they did. March-April-May, the club was 26-29 with a run differential of -22. August-September-October, the Reds were 24-31 with a run differential of -42.
Bottom Line
Back to the big question. Has the Reds front office done enough? It’s the same question we asked last year at the August trade deadline.
While the pitcher/catcher report date is upon us, Opening Day is still a ways off. The Reds traditional home opener is against the Washington Nationals, Thursday, March 28.
That leaves Nick Krall and the Castellini family 50 days to make final changes for the roster.
Krall has told reporters the Reds are likely done making significant moves. They’ll continue to add around the edges like Monday’s signing of veteran utility player and Cincinnati native Josh Harrison. But fans shouldn’t expect a new impact player.
The Reds have added depth, but the new guys are projected to contribute little more than that.
Expert, objective projections point to a close NL Central race and a winnable division, just like in 2023. They also indicate the Reds, as currently constructed, are unlikely to win.
We all have different opinions about what the front office should do going forward. Here’s mine.
At some point, the Reds need to push in a few prospects chips. So far they’ve “spent” Joe Boyle on Sam Moll. At some point, they need to raise payroll back up to around league average. So far, they’ve “spent” $13 million more than last year’s record low, but are still $40 million below what they averaged spending in the three seasons of 2019-2021.
If the Reds want to sign a true impact player, four of the top free agents remain unsigned: Cody Bellinger, Blake Snell, Matt Chapman, and Jordan Montgomery. Trades are always available if the front office can figure out one that makes sense for both teams and be willing to do it. Every trade announced in the league is evidence of that.
At last year’s trade deadline, the front office quit too soon. Two more wins and maybe David Bell’s team could have gained the valuable experience playing into the World Series that the young, 84-win Diamondbacks did.
Let’s hope Nick Krall and the Castellinis aren’t repeating the same risk-averse, prospect-pinching mistake now. At some point, to win you have to pay market prices, or maybe even risk overpaying.


How good is xwOBA at evaluating bunting, something that is part of Friedl’s game but not a typical player’s game? Second, I realize the projection systems are objective, but what kind of error rates do they have? For example, PECOTA has the Orioles taking a dive, they seem to be at least as good as they were last year. PECOTA missed on them big time last year, too. The projections appear to underestimate younger team while overestimating older squads (i.e., what have the Cards done to go worst to first?).