Earlier this season, I looked at expected batting average (xBA) and expected slugging percentage (xSLG) and how Reds hitters perform in each category. However, perhaps the most important “expected statistic” is expected weighted on base average (xwOBA).
To understand xwOBA, first you need to understand wOBA itself. wOBA was created by sabermetrician Tom Tango and attempts to capture a player’s overall offensive value. Essentially, Tango argues that not all on base events (hits, walks, and hit by pitches) are equal, which we already somewhat knew. However, Tango’s argument lies in the fact that, while OPS attempts to differentiate types of hits, it still doesn’t accurately measure the differing values, especially between a single and a walk.
wOBA attempts to more accurately weight different events, and it’s placed on a scale similar to on-base percentage for ease of understanding. For reference, the league average wOBA in 2021 is .314. While wOBA isn’t easy to calculate, FanGraphs does list out the formula if you are ever interested in trying it out yourself.
Now that you have somewhat of an understanding of wOBA, we can get into its expected component. Much like xBA and xSLG do for their counterparts, xwOBA attempts to use Statcast’s batted ball data to estimate what a player’s wOBA should be.
Given this understanding of what xwOBA actually is, let’s take a look at how Reds hitters have fared in the metric this season. For the purposes of this analysis, we will again look at only the hitters with at least 150 plate appearances this season as we did with xBA and xSLG.

As you can see, just three players had a higher xwOBA than their actual wOBA: Shogo Akiyama, Eugenio Suárez, and Joey Votto. Suárez’s xwOBA is actually slightly better than league average, though his actual wOBA is below league average. In Akiyama’s case, both his wOBA and xwOBA are well below league average. Votto, meanwhile, is in elite territory for both metrics, ranking 10th among qualified hitters in wOBA and xwOBA.
It’s also worth noting that Kyle Farmer has a better than league average wOBA but a below average xwOBA. This provides some concern that his future performance might fall off, which is especially worrying given that he hasn’t been a standout offensive performer to begin with. A further fall from his current numbers could negate any sort of defensive value he provides.
Tucker Barnhart is the other concerning player here. His xwOBA is just .266, which would be the worst among all Reds hitters with at least 150 PA and ranks in the bottom 10 of all qualified MLB batters. Again, a further fall from his current offensive production would likely negate most of his defensive value, especially when Tyler Stephenson has already outperformed him significantly with the bat.
While a few others have a somewhat notable difference in their expected and actual numbers, none of them significantly impact their value and perception. In the case of Nick Castellanos and Jesse Winker, for example, both remain elite regardless which metric you look at. Stephenson remains solidly above average in xwOBA as well.
Much how we can use xBA and xSLG to help predict a hitter’s future performance, the same can be done with xwOBA. The difference is that xwOBA attempts to capture a player’s overall offensive value rather than painting a limited picture containing just one aspect of a player’s offense.
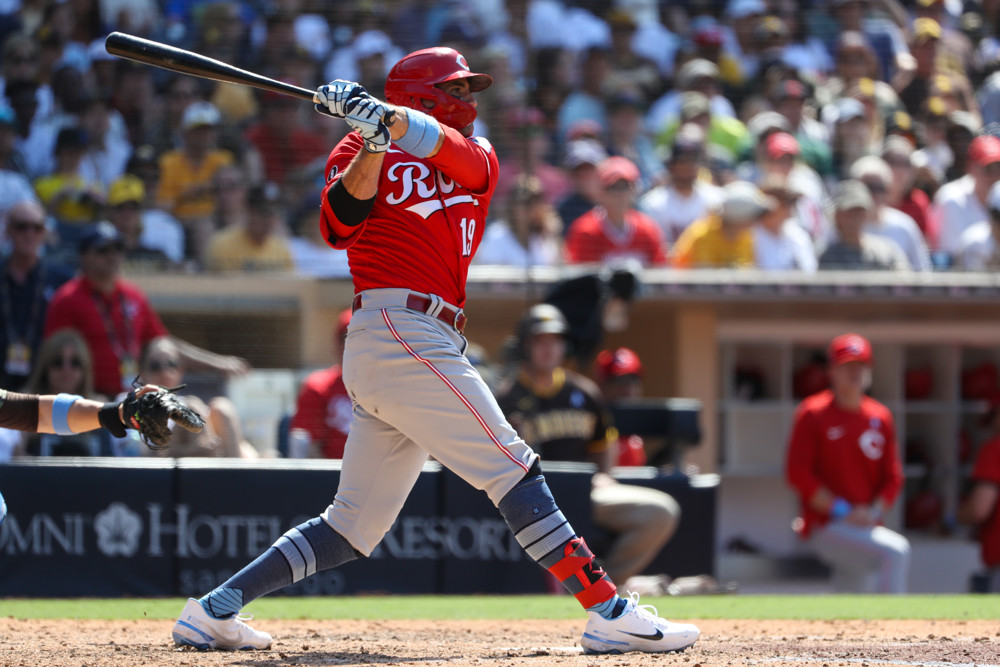
Photo by Kiyoshi Mio/Icon Sportswire


Is diversity of spray chart involved in this metric or can a predictable hitter that can be shifted really take a hit between his xwOBA and his wOBA?
Good question and the answer is complicated. In theory, if a batter has a pattern where he hits (most do) defenders could play there and take away balls that should be hits (xwOBA) but turn into outs (wOBA) producing a gap. But factors that mitigate that: (1) Shifting deals with infielders, so mainly talking about singles. (2) Balls hit to the opposite field are hit with less exit velocity, so again, reduced impact. (3) What’s “expected” evolves as time passes so shifts are factored into what’s expected more now. My sense is that the end result is minimal.
A bit of data: Left-handed batters are shifted much more than right-handed batters. But the deviation between wOBA and xwOBA is minimal. In 2021, LHB expected wOBA is .315 and actual wOBA is .313. Right-handed batters the gap is .315 (actual) vs. .314 (expected).
Interesting…
Looking at the pitching side of that stat, Wade Miley is pretty much the worst in the rotation. I know he’s been probably the most productive Reds pitcher this year, but if the expected stats don’t line up, maybe he’s not worth the $10 million option. Time to ask Lodolo and/or Greene to shine. Add in that Barnhart may not be worth his option. You just freed up $17.5 million next year. Another $8 million frees up the next year when you cut Shogo loose.
If you can get someone to take $5-7 million of Moustakas’ contract off your hands, then you’re really freeing up some money to sign Castellanos to a 5 year $90 million deal.
I’ve always been more Miley-skeptical than others. But he was a solid part of the rotation for most of 2021. That said, his x-numbers are middle of the pack overall as you mention. I think picking up his option is a close call. But his ERA and wily-veteran status are catnip for ownership and front offices, especially so for the old-timey Reds. I’d be shocked if they let him go.